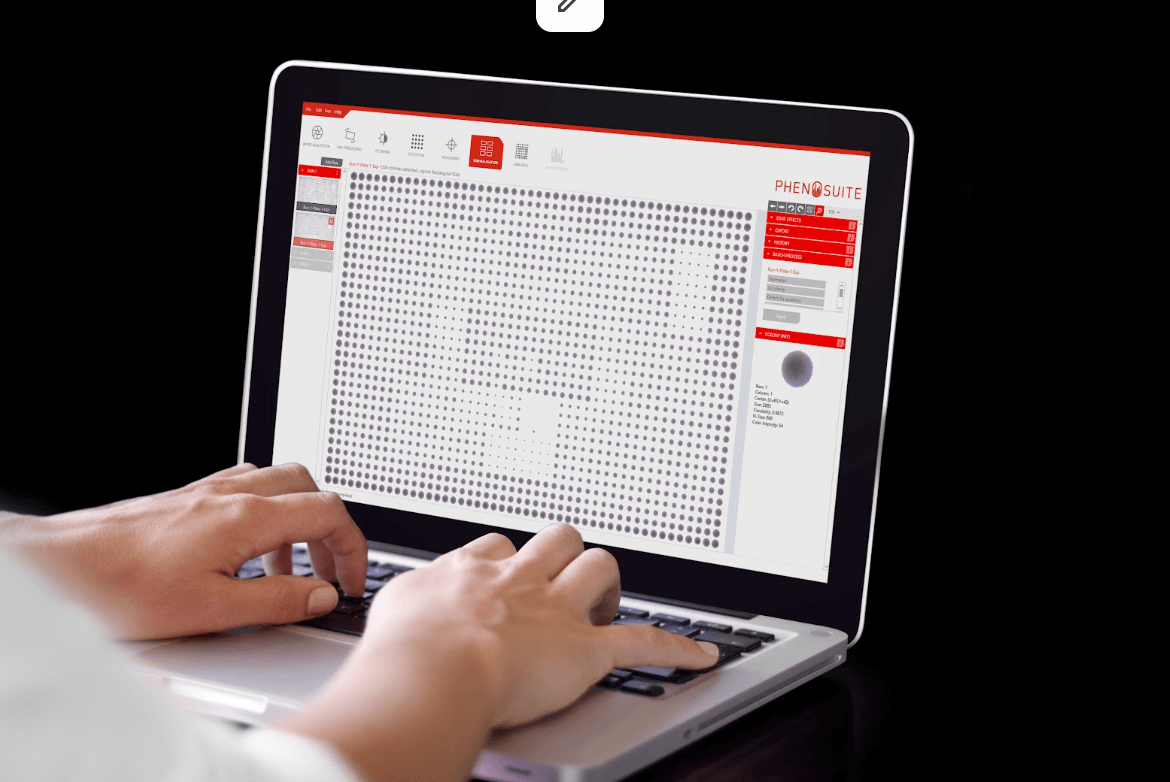
What is PhenoBooth+?
Phenobooth+ is an all-in-one colony counter for high throughput fitness assessment of microbes grown on solid media.
Now with inbuilt growth curves, heatmaps and statistical charts designed to promote easy data visualisation and management, helping you understand your results faster.
Use PhenoBooth+ in isolation for medium throughput colony phenotyping and counting. Or go next-level by pairing with ROTOR+ to underpin systematic, data-driven investigations analysing tens or even hundreds of thousands of clones at a time.
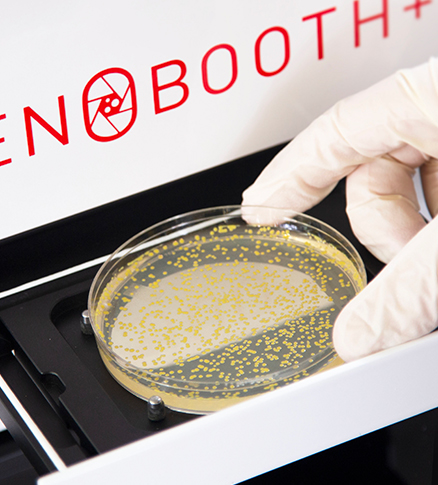
1. Load a Petri or
SBS plate
With visible bacteria, yeast or other microorganisms.
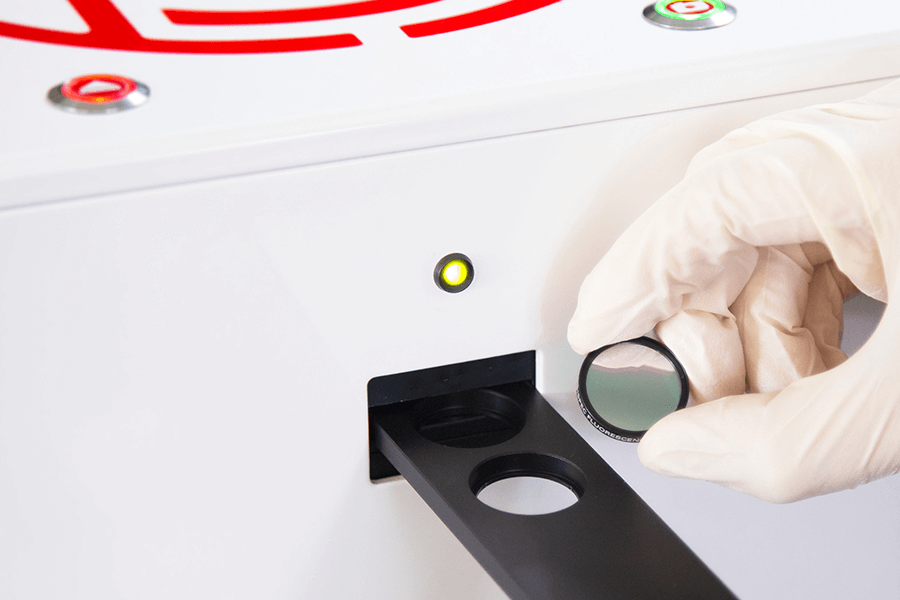
2. Select your preferred wavelength
Autofocus and image each plate in seconds.

3. Filter for properties of interest
Hit ‘Batch Analyse’ to apply across all of your plates.
“PhenoBooth+ offers an extremely quick and easy way to assess
how successful mutant library creation has been.”

Dr. Mato Lagator, Manchester University
Mato, a biologist and evolutionary theorist, employs both experimental evolution and synthetic biology for his research into gene regulatory networks and the emergence of antimicrobial resistance. Find out more
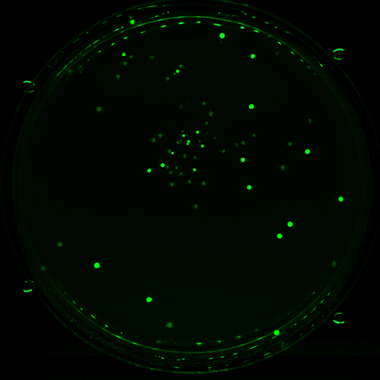
Fluorescence
Choose from multiple lighting and filter options, optimised for detection of BFP, GFP, mCherry and mRuby signals.
Screening for fluorescence on agar offers incredibly high throughput (up to 6144 colonies per SBS plate) making it wildly more cost-effective than liquid-based approaches.
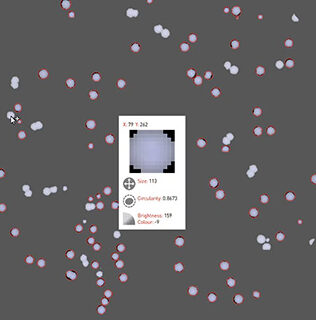
Detect hits instantly
Mouse over each colony to see its gene name and variation from control and between replicates. No more trawling spreadsheets.
Perfect for comparing colony size of experimental and control conditions to determine growth effects.
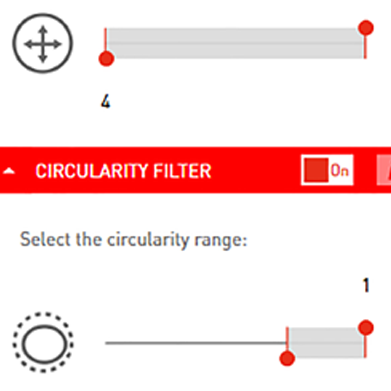
Batch processing
Filter colonies by size, circularity, colour or brightness. Then hit ‘batch analyse’ to apply the same parameters to all your plates.
No more fiddling around with image capture settings. Just autofocus and capture your plates in seconds.
No more fiddling around with image capture settings. Just autofocus and capture your plates in seconds.
Data visualisations
For each plate or batch, colony parameters (size, brightness, circularity, redness and the RGB values) can be visualised within plates using heatmaps,
or compared across plates with boxplots. Add in optional data normalisation steps to ensure those irksome edge-effects don’t skew your data.
In-plate and between plate normalisation
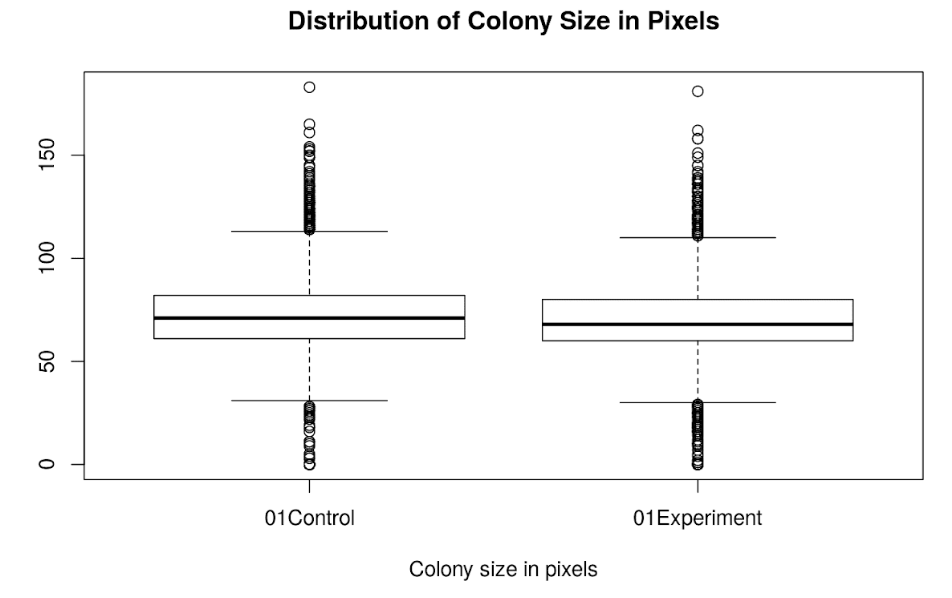
Box plots
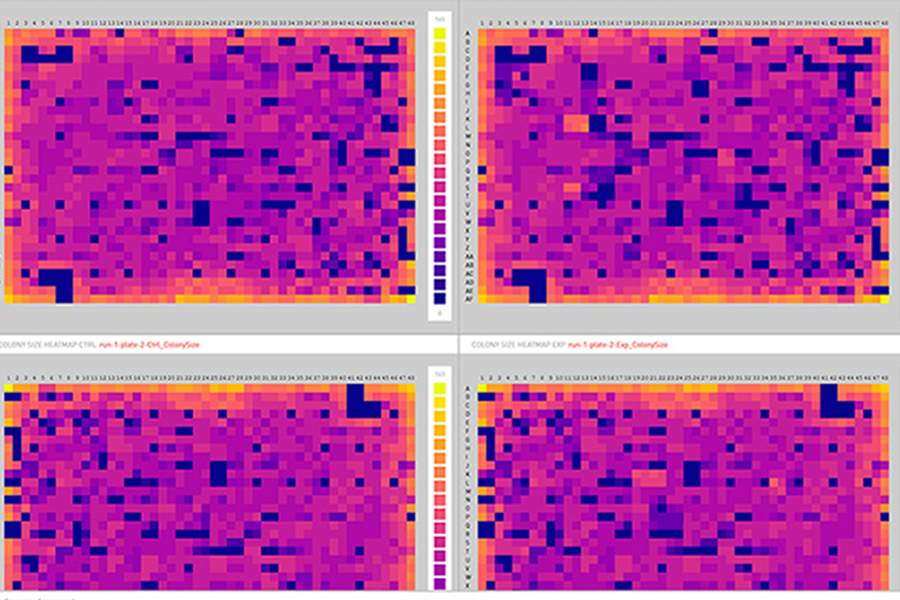
Heat maps
“We have relied on ROTOR+ and PhenoBooth+ for many high-impact papers, they indirectly fund our lab!”

Professor Daniela Delneri, Manchester University
The Delneri lab employs yeast biotechnology and strain development, experimental evolution, biological systems and environmental genomics to study speciation in yeasts.
Get in touch
Book a 30-minute slot to discuss your workflow with one of our product experts, or ask us anything.